Showing posts with label fantasy football. Show all posts

Sunday, 16 January 2011

After the WC and DIV week - Superbowl and Fantasy Football Playoff Roster winner predictions

After today's unexpected loss of NE to the NYJ a lot of clarity was brought to the RKB playoff fantasy football pool predictions. Firstly the model probabilities for the SB matchup and winners.


The most likely outcome and matchup is PIT playing GB in the superbowl and GB winning.

Because many rosters in the playoff pool had NE players a large number of potential winning rosters (including my own) were wiped out and have no chance of winning. Also, the GB and PIT games this weekend generated a lot of points for rosters which had those players. Finally, not very many people had NYJ and CHI players in their rosters. The combination of these factors means that for the purposes of my simulation model there is not difference in the 1st and 2nd place winners among the several superbowl mathcups and outcomes.

The expected winner of the pool is roster 64, Rich V 3, built on a GB/PIT superbowl matchup with GB kicker, QB and DEF, and filled in with PIT players for the extra RB and WR. The second place winner is roster 9, Bruschi Drink 4, which contains all GB players. The roster just placing out of the money in third place is roster 58, RDK 2, my roster built around GB kicker, QB and DEF, with NE and PIT players filling out the RB and WR positions. There is no graph because these are the results in 2000 simulations no matter the team outcomes. I didn't bother with 10,000 simulations because for this model the results look pretty unequivocal.

The results show a failure in the model in that there is no link between team performance and player performance except for the number of games played. Additionally it doesn't take into account good or bad days for players since it only uses the average number of points per game for the year. There is good and bad news in this. A weird combination of player performance could let me squeak through and win the pool, but that same combination could let a 4th or 5th place through to win. The only way to get better information is to get game by game data to try to get the variation in player performance into the simulation.

Saturday, 15 January 2011

Simulation and Prediction: Winning Rosters Fantasy Football Playoff pool

The purpose of the fantasy football playoff roster simulation is to search all of the possible combinations of player rosters for the one roster that has the highest chance of beating the other rosters. To do this I have first simulated the expected outcomes of the playoff games using Sagarin ratings. I also collect the expected performance of each player in each given game from available data about their performance this year. Combing the two yields the expected performance of a given roster and then I compare lists of rosters to each other to see which roster beats the other roster the most times.

My goal is to find roster which score a lot of points and which do well in comparison to their competition. Additionally the search is also for rosters which win over the various high probability outcomes of the playoff season. The model is displayed diagrammatically below.

Using the simulations of the NFL playoffs, the average expected points for a given player per game, we can simulate the performance of fantasy football playoff roster against one another. Now that we know the 72 rosters competing in this year's RKB fantasy football playoff pool, the simulations allow us to see what the probability of rosters being in the first two places, those placements are in the money for this playoff pool.

Before the wild card week during creation of my rosters I used a similar technique with 20 roster that I picked to try to choose the best roster. I chose rosters that had players from teams that played the most games and had players with a high average number of points per game. I also tried to cover the different possible superbowl matchups. From the 20 I chose 5 rosters that I felt covered the potential matchups. The chart below shows the performance of those rosters vs. the 72 participants in this years RKB fantasy football playoff pool.


The chart shows the frequency of the first 20 outcomes for first and second place combinations in 10,000 simulations. Green bars are rosters in which I place in the money, red are not. My rosters are 57 (RDK1, NE dominates ATL in SB matchup), 58 (RDK2, GB dominates NE or PIT in SB matchup), 59(RDK3, PIT dominates ATL in SB matchup), 60 (RDK4, NO dominates NE in SB matchup), and for the hometown 61 (RDK5, PHI dominates NE in SB matchup). Rosters are numbered by their alphabetical order on the RKB Fantasy football roster list.

Before the wild card games were played my rosters were in good position to be in the money according to the simulation results. One roster, 57 where NE is in the SB was so popular that two other participants picked exactly the same players for their rosters (2 and 56). Of the 91 different outcomes, 38 of them had my rosters in the money. Those 38 outcomes combined to 75% of the 10,000 simulations with my rosters in the money. But a the wild card week of playoffs has occurred the outcomes have changed.

After the wild card week, I modified the playoff simulator to reflect the fact that IND, KC, NO and PHI were out and reran the simulations. These simulations also included the actual point totals for players who played the first week added to the simulated totals for the games after the first one if a given player played any. Now there are much fewer possible combinations of possible rosters in the money (first or second place), but my rosters still figure prominently in the money. Once again, green bars are rosters in which I place in the money, red are not

Now their are only 20 possible outcomes of first and second place combinations according to the simulation. Of these 20 combinations, 8 have my rosters in the money. Those 8 represent 64% of the 10,000 simulations. This is a decrease from the estimate before the wild card games were played, but the most probably outcome, in which I am in a three way tie for first place, has gone from 11% to 22%.

I could still lose the chance to get money if really unusual events like SEA winning or New England losing occur, but the whole point of this was to have the fewest rosters which cover the most probability of being in the money.

Wednesday, 12 January 2011

SB winner predictions post wild card week

Before the NFL Wild Card week the Playoff fantasy football simulations showed the likely matchups were either NE or PIT vs. either ATL, CHI or GB with NO and PHI more distant possibilities on the NFC side and BAL, NYJ and IND as even more distant possibilities on the AFC side. A NE win of the superbowl vs. many different opponents figured high in the probabilities. The chart looked like this (click below for larger):


Now that the wild card games have been played and IND, KC, PHI and surprisingly, NO, have been eliminated, plugging those completed games into the simulation and running under those assumptions yields the following chart:


The earlier conclusion that NE or PIT would likely meet ATL, CHI or GB in the superbowl still holds. The NE vs. GB matchup seems to be the primary beneficiary of the NO and PHI losses. While the probability of SEA in the superbowl is now visible on the chart they are still a distant fourth place in probability vs. the other NFC teams. The balance of probabilities on the AFC side hasn't changed much, NE still leads with PIT a close second. The following chart is a Pareto chart of the likelihood of outcomes for matchups and SB winners with the wild card week results included.

It yields a more detailed view of the outcomes. Still, 79% of the time, NE or PIT meets GB, CHI or ATL in the SB.

My playoff rosters with NO and PHI concentration are eliminated now, but the roster with a GB focus expecting a NE, GB matchup is still very much alive and a contender for first place in the RKB fantasy football playoff pool.

Thursday, 6 January 2011

Superbowl winners, Simulations vs the Professionals

I took the odds of a given team winning the superbowl from Yahoo Futures for comparison with my simulation results. My results are in red below.


I match pretty well with 5dimes.com and SBGGlobal, but bodog looks too flat and I don't know what Sportsbook was thinking with the high probability for the New York Jets.

The agreement with some of the professionals lends some credibility to the results of my simulations and the roster decisions I will make based on them. I always say I don't know anything about football so I base my work on those who do and the people who set the odds need to know because they are trying to make money doing this.

Wednesday, 5 January 2011

Superbowl simulations - matchups and winners

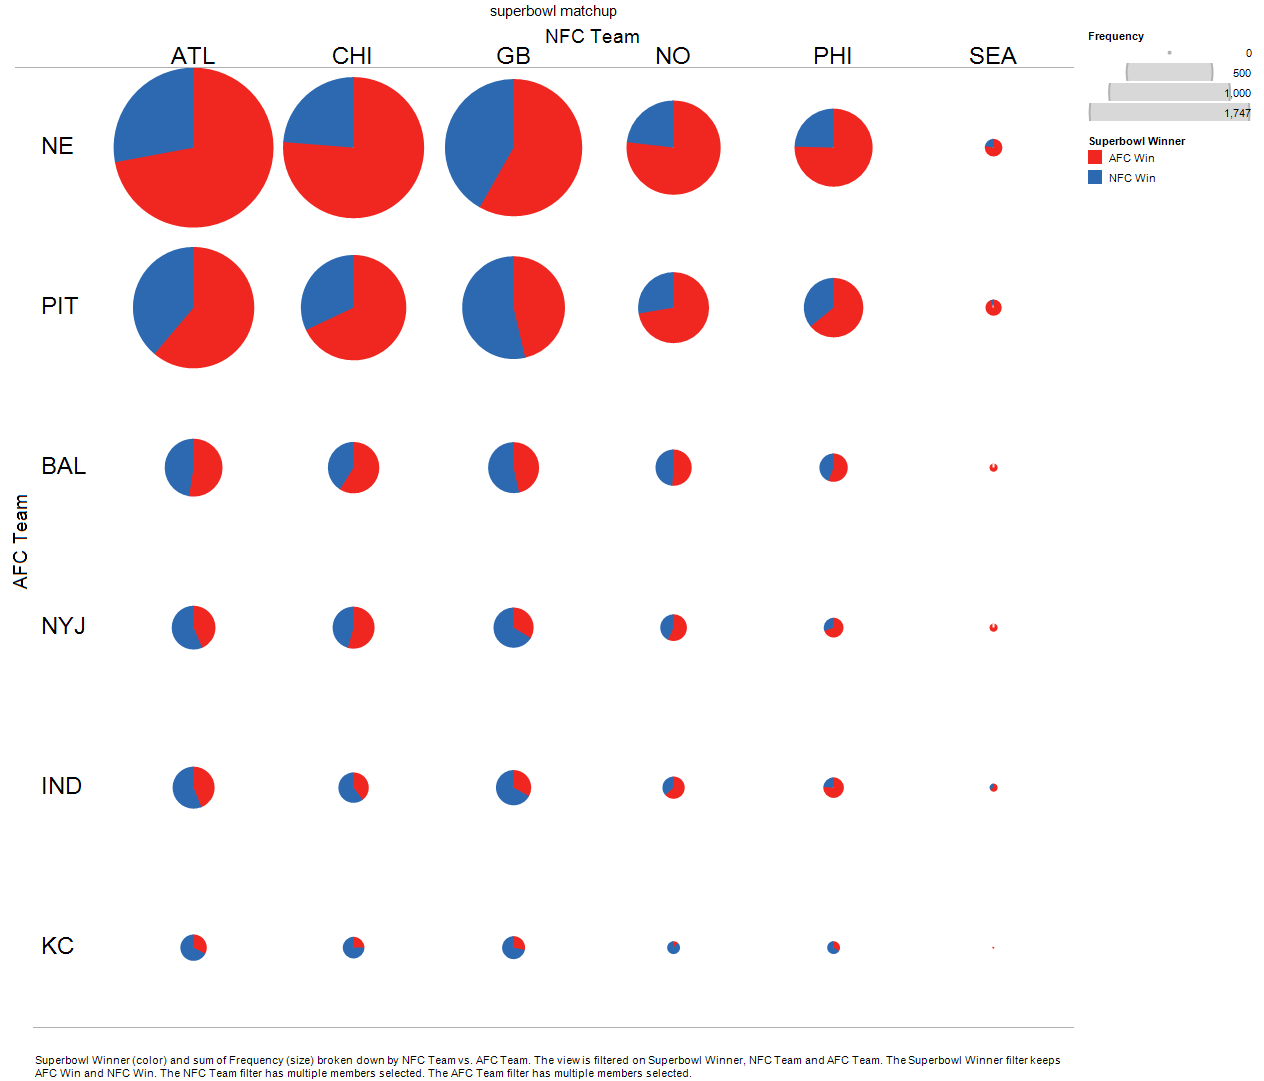
I am struggling to find the best way to present the data from my simulations of the football playoffs. The key to picking a good roster is to figuring out which teams play multiple games in the playoffs, essentially the ones that make it to the Superbowl. Thus I compiled 10,000 simulations of the playoffs and then determined who the AFC and NFC champions would be that would meet in the Superbowl and who the winner of that game would be. The pie charts below try to capture all of the outcomes from 12.5% chance that NE will beat ATL in the Superbowl to the less than 1 in 10,000 chance that SEA and KC would meet in the Superbowl.


The chart below is a filter of the above data with only NE or PIT as AFC champion, and ATL, CHI or GB as the NFC champion.


The Pareto below shows the top 15 outcomes for matchups in the Superbowl. They represent 78% of the outcomes of the simulations.


The matchups of either NE or PIT vs. either ATL, CHI or GB represent 68% of the outcomes of the simulations. The only wrinkle left there is which team will dominate the game an and so the makeup of the rosters to cover those possibilities. The results are heavily waited to not only a NE appearance in the Superbowl but also to a NE win.

Tuesday, 4 January 2011

Better Visualization of the Superbowl Simulation

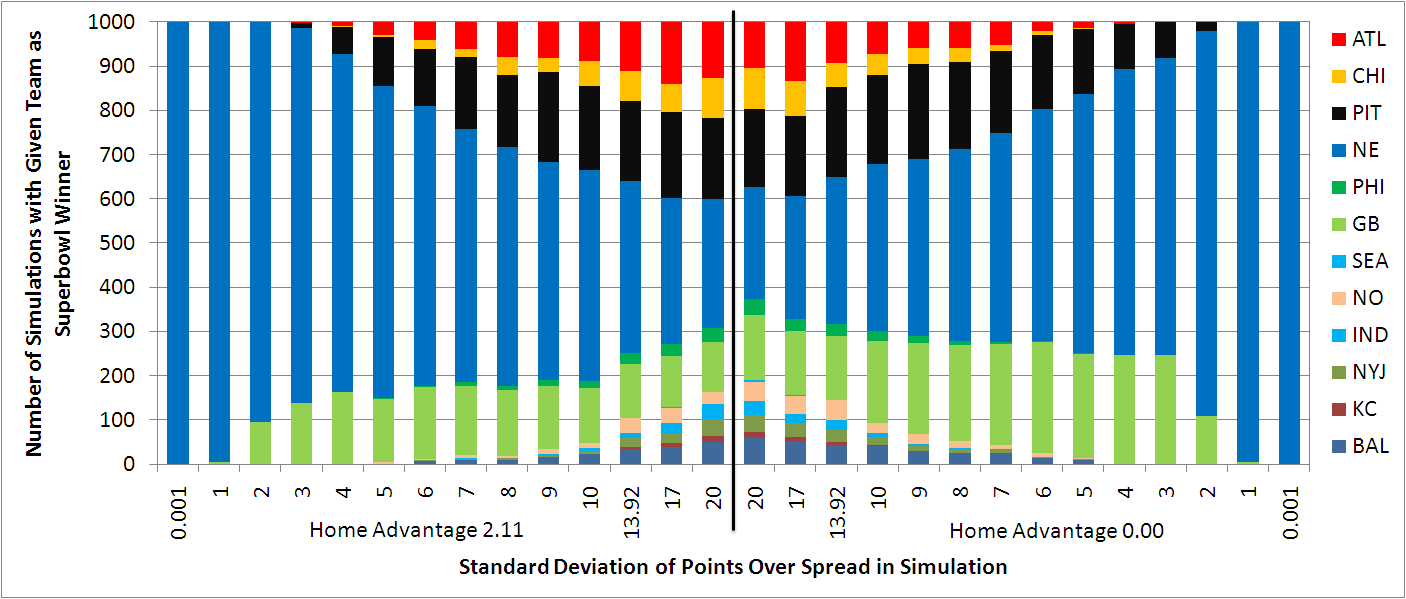
Rather than the bar charts from earlier I used Tableau to create pie charts showing the fraction of simulations in which a team wins the Superbowl as a function of the home advantage and the standard deviation of the normal distribution dividing the spread. (click the chart for larger).


Does this show better the expectation that New England would win assuming the straight Sagarin ratings determine the winner of each game? The stdev equal to 0.001 assumes that the favored team in the spread wins automatically. The fractions in the pie charts show how NE is dominant even using the normal distribution to more realistically represent teams' chances of winning. A stdev of 1000 is approaching the case where each game is 50/50. Notice the teams without a BYE are more likely to win the Superbowl in this case. That just because they play one fewer game and have one less chance to lose.

Players stats are entered and I am modifying the simulation to let me test 20 rosters at a time in 1000 simulations of the playoffs. More to come.

Monday, 3 January 2011

Who will win the Superbowl this year? Simulations suggest...

I am currently crunching the numbers for this year's Playoff Fantasy Football Pool. Using the Sagarin ratings and the formula discussed earlier, I have randomly simulated this year's playoffs many times to determine who will win the Superbowl. This year New England seems to be the favorite to win if we just assume wins based on the ratings. Even if we use 13.92 as the standard deviation and the spread and a normal distribution to calculated the probability of a team winning, New England wins about 33% of the time with no home advantage and 39% of the time with a home advantage of 2.11 points as given by the Sagarin ratings. The plot below shows how the winner varies with the standard deviation used in the model for either 2.11 points home advantage on the left or 0 points on the right.


Click on the chart for larger. The X-axis varies from a standard deviation from 0.001 which essentially assumes that the team with the higher spread wins through more reasonable scenarios with higher standard deviations which are more like what has occurred in previous NFL seasons.

Using the home advantage of 2.11 and a standard deviation of 13.92 simulations also show the likely teams to make it to the AFC and NFC championships. The plot below shows those results for 1000 simulations.

The likely matchup is either New England or Pittsburgh as AFC champion vs. either Chicago, Atlanta, or Green Bay as the NFC champion. Other teams have slim chances of appearing as seen down near the x-axis. Notably, New Orleans or Philadelphia have slim but noticeable chances to be the NFC champion, as well as Baltimore, New York Jets or Indianapolis having slim chances to appear as AFC champions.

Next step, collecting player data and simulations to make the perfect roster picks.

Sunday, 2 January 2011

Probability of winning an NFL game - recalculated after thirty years

It's NFL playoff time again. I am in the process of redoing my playoff football model to more accurately reflect the probability of a given team to win a game based on the spread or the Sagarin rating difference.

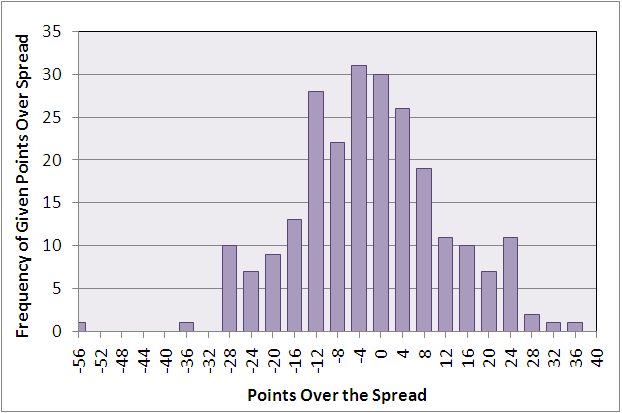
Stern wrote a paper called "On the Probability of Winning a Football Game" (1991) in which he collected the final scores and the spreads from 1981, 1932, 1984 to determine the relationship between the two. He found that the final score difference between the favorite and the underdog, subtracting the spread could be modeled with a normal distribution with standard deviation of 13.89. The average was 0.07 which is effectively zero for the purposes of the analysis. The probability that a team will win a given game is then the cumulative normal distribution around the spread with a standard deviation of 13.86, or normsdist(spread/13.86) using Excel functions.

I wondered if the analysis had changed in 30 years so I pulled the data for this year through week 16. The plot is below:

The standard deviation is 13.92 with an average -0.17. Hardly any difference found from the earlier analysis for a lot of work to extract the data and get it into a format for the analysis, but at least we now know it hasn't changed. The normsdist function with the spread replaced with the Sagarin difference (home+home advantage-away) divided by 13.92 is what will be used in the game simulation for the playoff fantasy football.

Tuesday, 9 February 2010

I'm in the money - Second Place in the Playoff Fantasy Football Pool

My roster (RDK 1) came in second in the the RKB Playoff Fantasy Football pool!

I predicted a significant chance (18%) that roster RDK 1 would be in the money! And it happened. I just want to take some time to gloat. My acceptance speech:
"I want to thank the Drew and the Saints for winning the Superbowl, especially their defense for that critical touchdown and Garrett Hartley - kick away Garrett. I also want to thank Joseph Addai for getting that touchdown that helped put me over the top, even though his team lost. And Adrian Peterson, you didn't even make it to the big game, but getting those touchdowns with no credit for Brett Favre really helped. Thanks to Yahoo for your player stats, and Sagarin for your ratings. And finally, I couldn't have done it without math and statistics, you guys rock!"


Here are the final results with all of the roster's points separated by position. It pays to have a good QB on the roster, but WR, RB and K's also contribute almost the same amount of points for the roster which are towards the top. Remember that there are 3 RW's and 2 RB's so the K has more point generating power as a single player. Even the defense can be significant. Probably the TE is the least useful point generating player on a roster.

The final results separated according to the game in which the points were generated reveals a truism that has been a guiding principle all along. Rosters with players that play more games generate more points. The light blue "dusting" of Superbowl points is what determined the winner this year.

A chart with the order of the roster based on the points before the Superbowl shows a little more clearly that the Superbowl points are what changed the order around. The top contenders had many or all NO and IND players left on their sheets, especially the big point positions like QB and K.

The rosters are shown above for the top twenty finishers, with just the players in the Superbowl on them. Realize that in the above some roster (like mine, RDK1) had players that did not play in the Superbowl and so are not listed above, however the correct total points are in the grand total at bottom.

The final contenders strategies were the three fold obvious ones, all NO, all IND or a mix. Give the way the game went it didn't pay to be all IND. I was able to thread my way to second place because I was a mostly NO roster, K, QB, DEF, but with enough IND to differentiate myself from others. Those that split the K and QB between IND and NO ended up not faring so well.

Finally, I simulated this outcome. Bruschi Drink 3 in first place and RDK1 in second, was the second most likely outcome in my simulations at 10% after the one with Tim G 5 in second.
The simulations above are from the prediction before the Superbowl. What happened to Tim G 5? That roster started 2 points behind RDK1 before the Superbowl. It had IND K instead of NO K for who were 5 to 11 in the Superbowl for 6 more points of deficit. RDK 1 beats Tim G 5 entirely due to the choice of kickers. Even if Matt Stover (IND) had made the field goal he missed that would only have added 3.

The simulations also picked out particular aspects of the game. About 40% of the time when New Orleans defense forces a turnover they get a touchdown. I included that in my model and lo and behold it happened during the game. Having Joseph Addai finally get a touchdown this playoff season pushed me over some of the NO rosters, but having NO do so well pushed me over the IND rosters. It also helped when Jeremy Shockey got a touchdown because no one of the top contenders had him for points. Sometimes it is just as good when no one gets the points as when your roster gets the points.

Next up, March Madness simulations. I have to go get started.

Thursday, 28 January 2010

18% Simulated Chance of winning money in the Playoff Fantasy Football pool

This year I have a roster (RDK1) that is currently in fifth place in the RKB Playoff fantasy football and in striking distance of first or second place and winning money in the pool. The goal is to determine the chances of that happening. The focus of this simulation is to answer the question "With only the Superbowl to go, will the RDK1 roster be in the money at the end of the playoffs?" and "What combination of player results does RDK1 need to be in the money and what is the chance that such an outcome will occur?"

Developing the simulation required the following steps and assumptions.
1.) Collect the data for each player or teams games for this season. Turnovers and touchdowns for DEF (and special teams); field goals and extra points for the kickers; passing and rushing touchdowns for the quarterback, wide receivers, tight ends; rushing touchdowns for the running backs. I will randomly select from this history to generate simulations of the Superbowl.
2.) Assume a player's performance in the Superbowl will be identical to their performance in one of the games they played in this season. If a player didn't play they get a zero for that game, except for the kickers for which I only have partial season data. This may decrease the points slightly, and is potentially a bad assumption.
3.) Kickers get their own field goals, but only get extra points equal to the touchdowns their team scores (actually all the rushing and defense touchdowns, but only the QB passing TD's to avoid double counting). Typically a game with field goals has less touchdowns, so decoupling the game history so that a game with a lot of touchdowns for the QB could be paired with a game with a lot of field goals for the kicker could result in a higher than expected points. Possible another poor assumption.
4.) Everybody (RB and QB) gets their rushing touchdowns, but passing touchdowns are awarded only if the quarterback throws at least one. There are instances in the game history of the QB's not throwing any. I really should assign each passing touchdown to a WR, TE, or RB or player not on the list but that is to complicated to program in excel. This may result in excess points, and is an expedient assumption.
5.) The score of the game is the field goals, rushing RD's, and only the quarterback's passing TD's to avoid double counting, and the defense/special teams touchdowns. This is slightly inaccurate since the passing touchdowns for the receivers are not all counted or double counted. The simulation still generates widely varying scores.
6.) Simulate many games by bootstrapping (selecting TD's or outcomes from each particular player's history this season. Add the points for each player to the rosters that have the players on them.
7.) Used the RANK() function to determine the places. Ties get the same rank using this function and the next ranks down are eliminated. For instance 3 first places get rank 1 and the next rank is 4. Rank is important to determine who is "in the money".
8.) As to the money, it is a fraction of the total collected from all of the rosters: 70% for first place, and 30% for second place. However, a tie for first divides the total money (100%) and there is no second, a tie for second with only one first divides the second place money, 30%, among the second place tied rosters. To be in the money RDK1 needs to be alone in first, tie first, or be alone or tied for second with only one first place roster ahead.


The rosters above show RDK1 roster in fifth place, but with enough similarities to other rosters both ahead and behind it that winning money in the pool will require some fine threading of the outcomes.

Remember that the focus of this simulation is to answer the question "With only the Superbowl to go, will the RDK1 roster be in the money at the end of the playoffs?" and "What combination of player results does RDK1 need to be in the money and what is the chance that such an outcome will occur?"

The histogram above (click for larger) shows the rank of the two top RDK rosters, RDK1 and RDK6 after the outcome of 20,000 simulations. The first red bar highlights the fraction of simulations with RDK1 roster in first place and in the money (alone or tied) at 1.4% of 5000 simulations. The green bar highlights the fraction of simulations with RDK1 roster in second place (alone or tied, with no first place tie) and in the money at 16.3% of 5000 simulations. RDK1 is in the money in about 18% of the 5000 simulations. RDK1 starts in fifth place before the Superbowl and can climb to first or slip to 13th place according to the simulations. There was some hope that RDK6 might have the potential to be in the money but from its starting point at 13th place, it never rises above 3rd place and can slip to 30th in the simulations.

Another way to look at this data is go ahead and calculate the winnings for each outcome.


This chart shows that the most likely outcome, 80%, is that RDK1 has no winnings, but the rest of the bars which add up to about 20% are various outcomes with winnings for the RDK1 roster.


This chart expands the Y axis to zoom in on the lower probability outcomes. There is a 10% chance of being alone in second place, a 4% chance of tieing second. There is even a less than 0.2% chance of being alone in first place. The less likely outcomes include situations in which I am tied with several others, up to 5 others, for first or, up to 7 others, for second. I need about 10% of the total collected to break even for the six rosters I entered.

Of course simulation generates outcomes for all of the rosters, otherwise I couldn't perform the comparisons needed to determine what place I am in or whether RDK1 roster will earn money. A less self-centered data reporting approach yields information about all of the outcomes.

The chart above (definitely click for larger) shows the histogram of the frequencies of the final rank after the Superbowl (simulated) of the top twenty rosters as they stand now(actual) before the Superbowl. The top twenty was chosen as a cutoff because it contains the lowest ranked roster that could win money in the simulations. The legend has the roster in their current ranking order (Cara H in 1st through RDK3 in 20th place). Bruschi Drink 3 ends most of the 1000 simulations in first with Tim G5 ending most of the 1000 simulations in second. there is a small but significant fraction of RDK 1 results in second place as we showed earlier. The chart will reward closer examination for the interested.

The information above can be used to determine the fraction of simulations (in this case, 5000) in which any given roster will be "in the money". The chart above shows that Bruschi Drink 3 is more than 80% likely to win some money followed by Tim G 5a at 42%. Almost a third of the time, Cara H in first place is likely to end up with some money. More annoying is that Bruschi Drink 4, a roster currently tied for 20th place, has a small but finite chance of being in the money. The results above do not total to 100% because more than one roster can be in the money (not just 1 and 2 but multiple rosters tieing for first, or one first place with multiple 2nds).

A compilation of the actual outcomes of each of 20,000 simulations can show the most likely particular outcome instead of the probabilistic compilations further above. The outcomes above compile the rosters in first or second place. Recall that in the case of a first place tie there is no second place.

As suggested by the charts further above, but shown directly in this one, the most likely first and second outcome at 22% is that Bruschi Drink 3 will be first with Tim G 5 second. The next most likely is heartening because it has Bruschi Drink 3 in first with RDK1 in second. Even so, these top twenty outcomes represent only 82% of the outcomes generated in 20,000 simulations. There are highly unlikely but predicted outcomes of all sorts, including some interesting ones with 6 tied in first place, or a first place with 8 tied for second, both only 1 time out of 20,000.

The RDK1 roster appears in these outcomes usually as a second place winner in the 2nd, 14th, 15th ,and 18th most likely outcome. You need to go down to the 17th most likely outcome to see RDK1 in first place, though it is tied with the ever successful Bruschi Drink 3.

Thus my final prediction is that Brschi Drink 3 will be in first place with Tim G 5 in second, though I am hoping for the 18% chance of RDK1, my own roster, being "in the money".

Wednesday, 27 January 2010

Who will win Playoff Fantasy Football Pool?

My clever analysis and modeling of this years football playoffs has yielded a roster (RDK1) that is in fifth place in the RKB Playoff fantasy football results as of the NFC and AFC Championship games. With only the Superbowl to go, the question is, "Will the RDK1 roster be in the money at the end of the playoffs?"

The chart above (click the chart for larger) shows the standings as they are right now, after the conference championship games. The y- axis is total points while the x axis is the name of each of the rosters. The colors represent contributions from each week of games, Red for the wild card week, blue for the divisional week and green for the conference championship week.

Disregarding the two lowest results, the Wild card and Divisional weeks yield anywhere from 65 to 30 points in a roster. A roster can also have a great wild card week and still lose, because your players have to generate points each week and that only happens if their team progresses. Which of these rosters will win, will it be Cara H. in the lead with 119 points?

The above plot is the same data and roster, this time sorted first by the number of players a roster has out, and then by the total points. This chart is very telling because the rosters to the left with no players out or few players out have much more points potential than roster to the left with more players out. The last grouping with all nine players out on their rosters is the most pathological example; they have all the points they are going to get. Tim G 2 with a respectable 101 points is still not in the running. By the way, the RDK1 roster only has 3 players out, and since I still have my quarterback, kicker, and defense.

Taking the starting chart and plotting the contributions from each player position to the total shows the importance of the the positions to a successful roster. The colors in the chart above represent points from a particular position, green for quarterback (QB), yellow for the wide receivers (WR), orange for running backs (RB), red for kicker (K), purple for defense (DEF), and blue for tight end (TE). The greater contribution positions are at the bottom and build up to the total number of points.

QB is the most important, and while RB and WR also contribute as much, realize that there are three WR's and two RB's per roster so the contribution above should be halved for RB or divided by three for the WR's. As an individual player the kicker contributes a fair amount of points, almost always one for each touchdown, and then field goals as well. In this league the DEF gets the special teams points if kickoffs or punts are returned for touchdowns, as well as a point for each turnover after there are three. Finally tight ends rarely receive passes in comparison to wide receivers and their contributions are the smallest.

Above is the leader grid (click for larger) with the top twenty team rosters and with only the players that are left to play in the Superbowl. A grayed out square indicates that that roster doesn't have the player, numbers are the accumulated points for a given player in that roster. The grand total is the total for each roster, and the rank is as of now. The red highlight is first, and green is second, yellow are the rest of the top ten. I included the top twenty because I have evidence that one of them can come in first, though it would be very unlikely (less than one in a thousand)

What combination of player results does RDK1 need to be in the money (70% first or 30% second place, a tie for first divides the money and there is no second, a tie for second with one first divides the second place money), and what is the chance that such an outcome will occur? That is the topic for the next analysis.

Thursday, 14 January 2010

Playoff Fantasy football arises again

It's time again for playoff fantasy football. Since you don't have to maintain your concentration for 17 weeks, it is a good way for non-football fanatics to play without a huge commitment of time. My sister runs a points-only league so the rules are straightforward: Pick a kicker, quarterback, two running backs, a tight end, three wide receivers and a team defense from the list of players and teams in the playoffs. You get the sum of the points these players or defense, special teams included, scored during the playoffs (the detailed, but simple rules are here).

Having developed a model last year, I simply had to enter this year's teams and Sagarin ratings and the simulation was already to run in last year's format. My process for hopefully picking the winning roster has several steps.
1.) Data collection: Collect the Sagarin data on team ranking and performance and the data (I used Yahoo) on player and defense touchdowns, field goals, turnovers.

2.) Playoff game simulation: Simulate the playoff games to determine which teams are likely to play the most number of games. Wild card teams that play four games are best, teams that play three games are also good (and likely won played in the Superbowl). Determine which teams are the most likely to make to to the Superbowl. The model currently runs 1000 simulations at one time.

3.) Initial Roster Selection: The model automatically calculates the points for a given roster using the information from the games played and the stats of the players selected. Rank the players and defence by their points stats and build some rosters based on that. Also build rosters using the information of how many games a player's team plays. Also randomly choose some rosters with high point values. These are the initial seeds for the "genetic" algorithm below.

4.) Optimize and find highest point rosters: Using the rosters generated above, the spreadsheet makes combinations (or cross breeds) of the rosters (the current model pool is 33 rosters) and I keep the highest point value rosters that are generated. Sometimes I let the model use a random player in a given roster spot to ensure that I have explored all of the possibilities (random mutation). Usually the selection is from the current list of high value rosters. This year the search did find higher value rosters than the initial seeds. I would sorely love to automate this step. Perhaps in the next version of the model.
Having already developed the model for simulating the playoffs and playoff rosters made the modifications I made this year easy, and I was able to do them in enough time to have an impact on the rosters I chose for these years Playoff fantasy football pool.

The new schema is simple. Either of the two teams with the same Sagarin ratings either team should be expected to win with a probability of 50%, since the ratings represent the number of points a team will score in the game. If a team has no points then it is expected to lose all of the time. Thus I proposed that the probability that team1 will win is...
team1 rating /(team1 rating + team2 rating).
To include the Sagarin home advantage this really becomes...
home team rating + home advantage /(home team rating + home advantage + away team rating).
For the monte carlo simulation, a random number between 0 and 1 less than the above probability means that the home team has won.

This preserves our earlier assumptions of evenly matched teams and team with no points and all of the arguments about its appropriateness fall to discussing what happens in between, and the validity of the ratings themselves. Sagarin suggests using the pure points for predicting the outcome of games rather than his ratings, so that is what I used.

Recall that we are trying to determine how many games each team will play so that we can pick players or defences that not only score points, but also have a three or four game, rather than one or two, in which to score them. The best player in only one game may not be the best choice. (The record breaking, once in the history of the playoffs, Green Bay and Arizona game notwithstanding.)

I generated 100,000 simulations of the playoffs using the model above and tabulated the team matchups in the Superbowl. Click on the chart below for larger.


Chart of the likely matchups using the Sagarin pure points sorted by the probability of the outcome. Circles represent the median of 100 trials of 1000 simulations, diamonds bracket the 25th to 75th percentiles, crossbars the 10th and 90th, and the lines extend to the maximum and minimum variation in the results. Those matchups that are already eliminated by the wild card week of games are shaded out.

The top eight outcomes in the chart are matchups with either Indianapolis (IND) or San Diego (SD) playing Minnesota (MIN) or New Orleans (NO) in the Superbowl. The top outcome is the obvious NO beating IND in the Superbowl, while the second has them beating SD. Close examination of the first eight outcomes, out of 72 possible, shows them to really be set apart from the rest of the pack, and representing almost one third of the probability. Thus I chose rosters with players representing these matchups by setting the model to fix each particular matchup by giving high ratings to teams in question and then searching the rosters using the genetic algorithm method described above.

The next matchups on the chart are New England (NE) vs. New Orleans (NO) matchups, which I did have rosters supporting, but which are now eliminated because NE lost in the Wild card weekend. There are other chances for the harsh light of reality to burn away my optimistic modeling by having one of the team I didn't pick due to low probability, Dallas or Arizona, for instance, to go all the way and destroy my roster's chance of winning.

We can check some of the predicted outcomes of the model by looking to other sources of odds or probability for teams in the Superbowl. I took the Yahoo Odds Futures sheet, collected the teams in the playoffs, and normalized the probabilities to have the total outcomes equal 100% to get a list of the teams in the playoffs and the chance that each one would win the Superbowl. I did the same with my simulations.


Above is a chart (click the chart for larger) of the winners predicted from the Yahoo odds futures and from a simulation of 100,000 outcomes using the Sagarin pure points ratings and my new scheme for randomly simulating the winner of each matchup. Those teams that are already eliminated are shaded out. The error bars on the Yahoo odds are plus or minus one standard deviation of the six betting ratings, and the ones on the Sagarin simulation reflect the standard deviation of 100 trials of 1000 simulations.

The good news is that the two four teams are the same for the Yahoo odds futures and my simulations. Yahoo odds favors IND as the top outcome by probability, whereas my simulations show New Orleans to be the top. We can redo the chart, now taking into account the results of the Wild Card week's games.

For this chart (click for bigger) I used today's yahoo Odds futures and I set my simulations to ensure that CIN, GB, NE and PHI lost their games (by either setting their ratings at 0 if there were the away team or to minus the home advantage if they were the home team). The yahoo odds still favor IND but now DAL and MIN are rising in the odds. My simulation based on the Sagarin simulation has more changes, NO is slightly favored over the others, but the evenness of probabilities between IND, MIN, SD and BAL, DAL, and NYJ is disconcerting since I have rosters built on players and matchups from the first group, and not from the second group. BAL, DAL, or NYJ wins next week are bad news for my picks. Alternatively, if ARZ does better than expected as they have already, I will also lose the Fantasy Playoff football pool.

(Potentially next post, some analysis of the actual roster from this years Fantasy Playoff football pool.)

Thursday, 3 December 2009

Picking against the spread in football (is difficult)

This year I am participating in a football pool where you must pick the team that win against the spread for each week. It is much harder than picking the winning team because the spread is supposed to even out the betting money on each side is the wisdom of the crowd opinion of the score difference that has the favorite beating it 50% of the time and losing 50% of the time.

I compiled the results up to week 12 of the current season.

It hovers around the 50% mark as you might expect. But there are fluctuations, and in those fluctuations there is money to be won. As I have said, I don't know anything about football, so I have been trying to see which teams not just win, but do well (or poorly) against the spread in the hopes of figuring out which teams the bookies are having trouble with and get an edge. My results thus far are still about 50/50. I told you I don't know anything about football.