Clearing out the book lists - both sets probably go in the Books I've read sometime in the past pile now, except for How to Ditch Your Fairy. Didn't get to that one yet.
Books I'm Currently Reading Books I've Just read
Monday, 31 January 2011

Thursday, 27 January 2011
Snow breaking my Dr. Seuss Juniper
I thought that we wouldn't have a repeat of last year's heavy snow which broke many limbs on several holly bushes and a juniper tree, all of which eventually got cut down and went into the fire.
This year the snow is breaking the other juniper.
 That limb on the ground used to be attached at the top and point straight up. It seems to have taken out to other limbs on its way down.
 A closeup of the damage shows the broken top, another limb missing halfway down, and another hanging on by a piece of bark.
 You can see how the snow is bowing the limbs down to the roof.
 A view from the front.
This year the snow is breaking the other juniper.
 That limb on the ground used to be attached at the top and point straight up. It seems to have taken out to other limbs on its way down.
 A closeup of the damage shows the broken top, another limb missing halfway down, and another hanging on by a piece of bark.
 You can see how the snow is bowing the limbs down to the roof.
 A view from the front.
Snow pictures of the day with all precipitation types
There has been a lot of complaint that the weather forecasters missed the call on this recent storm. It started yesterday when we awoke to 4 inches of snow that was twice what anybody expected and was still snowing when we all thought it would turn to rain.
We had in sequence - snow, cloudy skies, rain, ice pellets and lots of snow again. My pictures begin in the middle with the measurement of last night's snow, which was the second wave. About 7.5 inches.
 Linus confirmed my measurement later in the shoveling. You can see my little meteorologist at work.
Then I got crazed with power after I finished shovelling the driveway. "
Look on my mighty snowpile ye snowflakes and despair. Fear my mighty shovel of power."
This has happened before.

Here is the pillowy snow covered rocks on Shellpot Creek.

The required waterfall picture.

And a closeup of the water flowing. The creek has actually risen above the earlier level where it froze so the water is flowing over ice stuck to the rocks.

A closeup of the water at the base of the waterfall.
We had in sequence - snow, cloudy skies, rain, ice pellets and lots of snow again. My pictures begin in the middle with the measurement of last night's snow, which was the second wave. About 7.5 inches.
 Linus confirmed my measurement later in the shoveling. You can see my little meteorologist at work.
Then I got crazed with power after I finished shovelling the driveway. "
Look on my mighty snowpile ye snowflakes and despair. Fear my mighty shovel of power."
This has happened before.

Here is the pillowy snow covered rocks on Shellpot Creek.

The required waterfall picture.

And a closeup of the water flowing. The creek has actually risen above the earlier level where it froze so the water is flowing over ice stuck to the rocks.

A closeup of the water at the base of the waterfall.
Wednesday, 19 January 2011
Deldot Traffic cams, my favorites embedded.
Just trying to see if I can embed the Deldot Traffic Cams pictures in a blog post. It looks successful to me. These will not update automatically, just refresh the browser to see them update. I chose cameras that are roughly on my way to and from work.
Traffic cam Rt 141 and EX stat., Cam 60

Traffic cam Rt 141 and 100, Cam 88

Traffic cam Rt 141 and Rt 48, Cam 76

Traffic cam Rt202 and Silverside, Cam 49

Traffic cam Rt202 and Rt 92, Cam 48

Traffic cam Rt202 and Rt 141, Cam 50

Traffic cam Rt261 and Silverside, Cam 51

Traffic cam Rt 141 and EX stat., Cam 60

Traffic cam Rt 141 and 100, Cam 88

Traffic cam Rt 141 and Rt 48, Cam 76

Traffic cam Rt202 and Silverside, Cam 49

Traffic cam Rt202 and Rt 92, Cam 48

Traffic cam Rt202 and Rt 141, Cam 50

Traffic cam Rt261 and Silverside, Cam 51

Sunday, 16 January 2011
After the WC and DIV week - Superbowl and Fantasy Football Playoff Roster winner predictions
After today's unexpected loss of NE to the NYJ a lot of clarity was brought to the RKB playoff fantasy football pool predictions. Firstly the model probabilities for the SB matchup and winners.

The most likely outcome and matchup is PIT playing GB in the superbowl and GB winning.
Because many rosters in the playoff pool had NE players a large number of potential winning rosters (including my own) were wiped out and have no chance of winning. Also, the GB and PIT games this weekend generated a lot of points for rosters which had those players. Finally, not very many people had NYJ and CHI players in their rosters. The combination of these factors means that for the purposes of my simulation model there is not difference in the 1st and 2nd place winners among the several superbowl mathcups and outcomes.
The expected winner of the pool is roster 64, Rich V 3, built on a GB/PIT superbowl matchup with GB kicker, QB and DEF, and filled in with PIT players for the extra RB and WR. The second place winner is roster 9, Bruschi Drink 4, which contains all GB players. The roster just placing out of the money in third place is roster 58, RDK 2, my roster built around GB kicker, QB and DEF, with NE and PIT players filling out the RB and WR positions. There is no graph because these are the results in 2000 simulations no matter the team outcomes. I didn't bother with 10,000 simulations because for this model the results look pretty unequivocal.
The results show a failure in the model in that there is no link between team performance and player performance except for the number of games played. Additionally it doesn't take into account good or bad days for players since it only uses the average number of points per game for the year. There is good and bad news in this. A weird combination of player performance could let me squeak through and win the pool, but that same combination could let a 4th or 5th place through to win. The only way to get better information is to get game by game data to try to get the variation in player performance into the simulation.

The most likely outcome and matchup is PIT playing GB in the superbowl and GB winning.
Because many rosters in the playoff pool had NE players a large number of potential winning rosters (including my own) were wiped out and have no chance of winning. Also, the GB and PIT games this weekend generated a lot of points for rosters which had those players. Finally, not very many people had NYJ and CHI players in their rosters. The combination of these factors means that for the purposes of my simulation model there is not difference in the 1st and 2nd place winners among the several superbowl mathcups and outcomes.
The expected winner of the pool is roster 64, Rich V 3, built on a GB/PIT superbowl matchup with GB kicker, QB and DEF, and filled in with PIT players for the extra RB and WR. The second place winner is roster 9, Bruschi Drink 4, which contains all GB players. The roster just placing out of the money in third place is roster 58, RDK 2, my roster built around GB kicker, QB and DEF, with NE and PIT players filling out the RB and WR positions. There is no graph because these are the results in 2000 simulations no matter the team outcomes. I didn't bother with 10,000 simulations because for this model the results look pretty unequivocal.
The results show a failure in the model in that there is no link between team performance and player performance except for the number of games played. Additionally it doesn't take into account good or bad days for players since it only uses the average number of points per game for the year. There is good and bad news in this. A weird combination of player performance could let me squeak through and win the pool, but that same combination could let a 4th or 5th place through to win. The only way to get better information is to get game by game data to try to get the variation in player performance into the simulation.
Saturday, 15 January 2011
Simulation and Prediction: Winning Rosters Fantasy Football Playoff pool
The purpose of the fantasy football playoff roster simulation is to search all of the possible combinations of player rosters for the one roster that has the highest chance of beating the other rosters. To do this I have first simulated the expected outcomes of the playoff games using Sagarin ratings. I also collect the expected performance of each player in each given game from available data about their performance this year. Combing the two yields the expected performance of a given roster and then I compare lists of rosters to each other to see which roster beats the other roster the most times.
My goal is to find roster which score a lot of points and which do well in comparison to their competition. Additionally the search is also for rosters which win over the various high probability outcomes of the playoff season. The model is displayed diagrammatically below.
 Using the simulations of the NFL playoffs, the average expected points for a given player per game, we can simulate the performance of fantasy football playoff roster against one another. Now that we know the 72 rosters competing in this year's RKB fantasy football playoff pool, the simulations allow us to see what the probability of rosters being in the first two places, those placements are in the money for this playoff pool.
Before the wild card week during creation of my rosters I used a similar technique with 20 roster that I picked to try to choose the best roster. I chose rosters that had players from teams that played the most games and had players with a high average number of points per game. I also tried to cover the different possible superbowl matchups. From the 20 I chose 5 rosters that I felt covered the potential matchups. The chart below shows the performance of those rosters vs. the 72 participants in this years RKB fantasy football playoff pool.
 The chart shows the frequency of the first 20 outcomes for first and second place combinations in 10,000 simulations. Green bars are rosters in which I place in the money, red are not. My rosters are 57 (RDK1, NE dominates ATL in SB matchup), 58 (RDK2, GB dominates NE or PIT in SB matchup), 59(RDK3, PIT dominates ATL in SB matchup), 60 (RDK4, NO dominates NE in SB matchup), and for the hometown 61 (RDK5, PHI dominates NE in SB matchup). Rosters are numbered by their alphabetical order on the RKB Fantasy football roster list.
Before the wild card games were played my rosters were in good position to be in the money according to the simulation results. One roster, 57 where NE is in the SB was so popular that two other participants picked exactly the same players for their rosters (2 and 56). Of the 91 different outcomes, 38 of them had my rosters in the money. Those 38 outcomes combined to 75% of the 10,000 simulations with my rosters in the money. But a the wild card week of playoffs has occurred the outcomes have changed.
After the wild card week, I modified the playoff simulator to reflect the fact that IND, KC, NO and PHI were out and reran the simulations. These simulations also included the actual point totals for players who played the first week added to the simulated totals for the games after the first one if a given player played any. Now there are much fewer possible combinations of possible rosters in the money (first or second place), but my rosters still figure prominently in the money. Once again, green bars are rosters in which I place in the money, red are not
 Now their are only 20 possible outcomes of first and second place combinations according to the simulation. Of these 20 combinations, 8 have my rosters in the money. Those 8 represent 64% of the 10,000 simulations. This is a decrease from the estimate before the wild card games were played, but the most probably outcome, in which I am in a three way tie for first place, has gone from 11% to 22%.
I could still lose the chance to get money if really unusual events like SEA winning or New England losing occur, but the whole point of this was to have the fewest rosters which cover the most probability of being in the money.
My goal is to find roster which score a lot of points and which do well in comparison to their competition. Additionally the search is also for rosters which win over the various high probability outcomes of the playoff season. The model is displayed diagrammatically below.
 Using the simulations of the NFL playoffs, the average expected points for a given player per game, we can simulate the performance of fantasy football playoff roster against one another. Now that we know the 72 rosters competing in this year's RKB fantasy football playoff pool, the simulations allow us to see what the probability of rosters being in the first two places, those placements are in the money for this playoff pool.
Before the wild card week during creation of my rosters I used a similar technique with 20 roster that I picked to try to choose the best roster. I chose rosters that had players from teams that played the most games and had players with a high average number of points per game. I also tried to cover the different possible superbowl matchups. From the 20 I chose 5 rosters that I felt covered the potential matchups. The chart below shows the performance of those rosters vs. the 72 participants in this years RKB fantasy football playoff pool.
 The chart shows the frequency of the first 20 outcomes for first and second place combinations in 10,000 simulations. Green bars are rosters in which I place in the money, red are not. My rosters are 57 (RDK1, NE dominates ATL in SB matchup), 58 (RDK2, GB dominates NE or PIT in SB matchup), 59(RDK3, PIT dominates ATL in SB matchup), 60 (RDK4, NO dominates NE in SB matchup), and for the hometown 61 (RDK5, PHI dominates NE in SB matchup). Rosters are numbered by their alphabetical order on the RKB Fantasy football roster list.
Before the wild card games were played my rosters were in good position to be in the money according to the simulation results. One roster, 57 where NE is in the SB was so popular that two other participants picked exactly the same players for their rosters (2 and 56). Of the 91 different outcomes, 38 of them had my rosters in the money. Those 38 outcomes combined to 75% of the 10,000 simulations with my rosters in the money. But a the wild card week of playoffs has occurred the outcomes have changed.
After the wild card week, I modified the playoff simulator to reflect the fact that IND, KC, NO and PHI were out and reran the simulations. These simulations also included the actual point totals for players who played the first week added to the simulated totals for the games after the first one if a given player played any. Now there are much fewer possible combinations of possible rosters in the money (first or second place), but my rosters still figure prominently in the money. Once again, green bars are rosters in which I place in the money, red are not
 Now their are only 20 possible outcomes of first and second place combinations according to the simulation. Of these 20 combinations, 8 have my rosters in the money. Those 8 represent 64% of the 10,000 simulations. This is a decrease from the estimate before the wild card games were played, but the most probably outcome, in which I am in a three way tie for first place, has gone from 11% to 22%.
I could still lose the chance to get money if really unusual events like SEA winning or New England losing occur, but the whole point of this was to have the fewest rosters which cover the most probability of being in the money.
Wednesday, 12 January 2011
SB winner predictions post wild card week
Before the NFL Wild Card week the Playoff fantasy football simulations showed the likely matchups were either NE or PIT vs. either ATL, CHI or GB with NO and PHI more distant possibilities on the NFC side and BAL, NYJ and IND as even more distant possibilities on the AFC side. A NE win of the superbowl vs. many different opponents figured high in the probabilities. The chart looked like this (click below for larger):

Now that the wild card games have been played and IND, KC, PHI and surprisingly, NO, have been eliminated, plugging those completed games into the simulation and running under those assumptions yields the following chart:

The earlier conclusion that NE or PIT would likely meet ATL, CHI or GB in the superbowl still holds. The NE vs. GB matchup seems to be the primary beneficiary of the NO and PHI losses. While the probability of SEA in the superbowl is now visible on the chart they are still a distant fourth place in probability vs. the other NFC teams. The balance of probabilities on the AFC side hasn't changed much, NE still leads with PIT a close second. The following chart is a Pareto chart of the likelihood of outcomes for matchups and SB winners with the wild card week results included.
 It yields a more detailed view of the outcomes. Still, 79% of the time, NE or PIT meets GB, CHI or ATL in the SB.
My playoff rosters with NO and PHI concentration are eliminated now, but the roster with a GB focus expecting a NE, GB matchup is still very much alive and a contender for first place in the RKB fantasy football playoff pool.
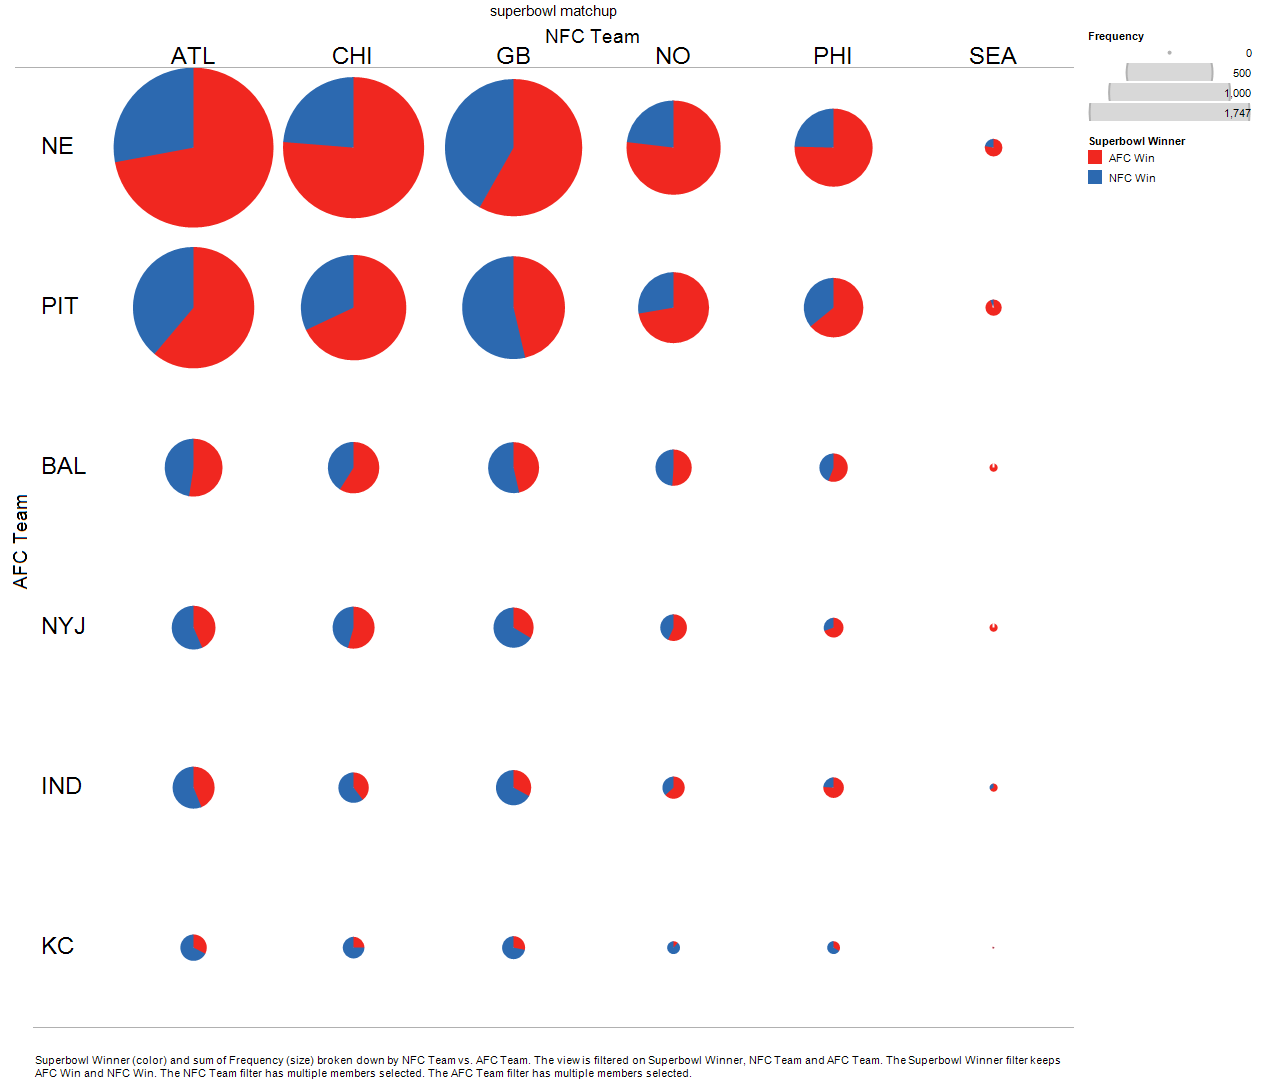
Now that the wild card games have been played and IND, KC, PHI and surprisingly, NO, have been eliminated, plugging those completed games into the simulation and running under those assumptions yields the following chart:

The earlier conclusion that NE or PIT would likely meet ATL, CHI or GB in the superbowl still holds. The NE vs. GB matchup seems to be the primary beneficiary of the NO and PHI losses. While the probability of SEA in the superbowl is now visible on the chart they are still a distant fourth place in probability vs. the other NFC teams. The balance of probabilities on the AFC side hasn't changed much, NE still leads with PIT a close second. The following chart is a Pareto chart of the likelihood of outcomes for matchups and SB winners with the wild card week results included.
 It yields a more detailed view of the outcomes. Still, 79% of the time, NE or PIT meets GB, CHI or ATL in the SB.
My playoff rosters with NO and PHI concentration are eliminated now, but the roster with a GB focus expecting a NE, GB matchup is still very much alive and a contender for first place in the RKB fantasy football playoff pool.
Subscribe to:
Posts (Atom)